Causes and Solutions for Filter Clogging in Wax Oil Hydrogenation Water Injection Pipelines
Abstract: Wax oil is a gas-phase product generated by the hydrogenation unit. Before entering the cold high-pressure separator, it is injected with a 1:1 mixture of desalted water and stripping purified water. After the unit was overhauled and restarted, the pipeline filter upstream of the water injection pump began to suffer periodic blockages roughly every 20 days, requiring routine cleaning. Analysis of the blockage material revealed it to be organic in nature. Testing of water hardness, suspended solids, and bacterial count in the two inlet streams feeding the water injection buffer tank indicated that excessive microbial growth and deposition were the primary causes of the blockage. Representative sampling points were selected for on-site monitoring and water sample analysis, focusing on parameters known to affect microbial growth—such as temperature, pH, chemical oxygen demand (COD), total nitrogen (TN), dissolved oxygen, and bacterial count. These investigations ultimately identified the underlying cause of the recurring filter blockages.
The wax oil hydrogenation unit is designed to conduct a series of catalytic reactions involving vacuum wax oil sourced from atmospheric and vacuum distillation units, along with coking wax oil from the coking unit. The process involves a series of reactions, including olefin saturation, aromatic saturation, hydrodesulfurization, hydrodenitrogenation, hydrodeoxygenation, and hydrodemetallization. The gas phase separated in the hot high-pressure separator is cooled to around 50 °C before entering the cold high-pressure separator, where gas, oil, and water are separated into three phases. Water is injected prior to the reaction product entering the air cooler to prevent the formation of ammonium salt crystals, which are caused by NH₃ and H₂S present in the hot high-pressure gas and can block the cooler at low temperatures. This water injection helps remove NH₃ and H₂S. Under normal operating conditions, a 1:1 mixture of desalted water and stripping purified water is used, with a flow rate of approximately 12 t/h. A schematic of the water injection process is shown in Figure 1.

Figure 1 Wax oil hydrogenation water injection
Following the overhaul and restart of the unit, the pipeline filter located upstream of the water injection pump in the wax oil hydrogenation unit started to experience periodic blockages. Upon disassembly and cleaning, the filter was found to be coated with a layer of sticky, muddy material, as shown in Figure 2. The same material was also observed on the walls of the water injection buffer tank. After cleaning, normal operation was restored; however, the pipeline filter became blocked again approximately 20 days after water injection resumed.
To maintain normal unit operation, the water injection for the wax oil hydrogenation process was changed from the original 1:1 mixture of desalted water and stripping purified water to 100% desalted water. After this change, the water injection pipeline filter no longer experienced blockages. However, using exclusively desalted water is costly and negatively impacts the refinery’s water intake index per ton of oil. Therefore, it is urgent to analyze the cause of the wax oil hydrogenation water injection pipeline filter blockage in order to identify an effective solution.
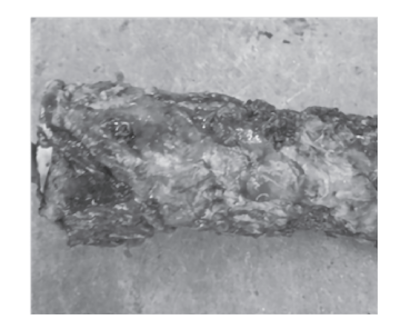
Figure 2 Blockage of water injection pipeline filter
The main procedure is as follows: dry the ceramic crucible in an oven at 120℃ until it reaches a constant weight. Cool it to room temperature in a desiccator. Then, add a known mass of the sample to the crucible, place it in an oven, and gradually heat to 120℃, maintaining this temperature for 2 hours. Then transfer the crucible to a muffle furnace, heat it to 550℃ at a rate of 10℃/min, and maintain this temperature for 5 hours. Allow the crucible to cool naturally to approximately 100℃ before removing it and placing it in a desiccator to cool to room temperature. Finally, weigh the crucible and calculate the weight loss rate.
Temperature, pH, and dissolved oxygen: measured using an HQ40d Hach portable multifunctional water quality analyzer
Chemical Oxygen Demand (COD): determined by the potassium dichromate method
Total Nitrogen (TN): measured using alkaline potassium persulfate digestion followed by UV spectrophotometry
Water hardness: determined by the EDTA titration method
Suspended solids: measured by the gravimetric method
Bacterial count: determined using the plate count method
To identify the cause of the filter blockage in the wax oil hydrogenation water injection pipeline, both the blockage material and associated water samples were collected and analyzed.
As shown in Figure 2, the filter blockage consists of sticky, thick muddy material that can be easily removed from the filter. In contrast, salt scale is hard and difficult to remove. Therefore, based on the appearance and characteristics of the blockage, salt scale has been ruled out as the cause. The results of the high-temperature burning test described in Section 2.1 are presented in Table 1.
Table 1 High-temperature burning test results of blockages
|
Product Mass (g) |
Mass After Burning (g) |
Weight Loss Rate (%) |
|
5.9832 |
0.0565 |
99.06 |
As shown in Table 1, the blockages lost almost all of their weight after high-temperature burning. It is therefore speculated that the filter blockages consist of organic matter, with no evidence of silt, clay, or pipeline corrosion. Further analysis of the water samples is required to definitively determine the type of blockage.
Blockages formed during the water delivery process are primarily composed of salt scale, dirt, and slime. Salt scale can be identified by measuring the total hardness of the water sample. Dirt refers to sediment formed by insoluble impurities, such as suspended solids in the water. Slime is a gel-like, viscous substance produced by microorganisms and their metabolites, combined with other impurities such as carbon, nitrogen, and various nutrients essential for microbial growth. Therefore, the chemical oxygen demand (COD), total nitrogen (TN), and bacterial count of the water samples can be used to determine whether the blockage is caused by slime. For this reason, it is necessary to analyze the hardness, suspended solids, COD, TN, and other water quality indicators of the desalted water and stripping purified water upstream of the wax oil hydrogenation water injection buffer tank to identify the type of blockage. The test results are presented in Table 2.
Table 2. Analysis Results of Desalted Water and Stripping Purified Water
|
Parameter |
Unit |
Desalted Water |
Stripping Purified Water |
|
Chemical Oxygen Demand (COD) |
mg/L |
8 |
106 |
|
Total Nitrogen (TN) |
mg/L |
1.3 |
10.4 |
|
Hardness |
mg/L (mmol/L) |
0.0 |
0.0 |
|
Suspended Solids |
mg/L |
0.0 |
0.2 |
|
Bacterial Count |
individuals/mL |
27,000 |
16 |
As shown in Table 2, the water samples have zero hardness, indicating the absence of insoluble calcium and magnesium salts. Therefore, no precipitation would form, and salt scale can be ruled out as the cause of the blockage. In addition, the suspended solids content is nearly zero, ruling out dirt as the cause. Moreover, when the COD concentration exceeds 10 mg/L, slime is likely to form. Considering the blockage’s appearance, its complete decomposition during high-temperature burning, and the elevated bacterial count in the desalted water, it is concluded that the blockage consists of slime resulting from extensive microbial growth.
After identifying the cause of the filter blockage, representative sampling points must be selected to analyze water quality parameters that influence microbial growth and reproduction. These include temperature, pH, nutrients (COD and TN), dissolved oxygen, and bacterial count, which are used to validate the above inference.
From the outlet of the water production unit to the wax oil hydrogenation water injection buffer tank, both desalted water and stripping purified water are transported through pipelines. To ensure representative sampling, the following locations were selected for water sampling and analysis:
- Desalted water and stripping purified water at the outlet of the water production unit
- Desalted water injection point upstream of the buffer tank
- Stripping purified water injection point
- Injection point upstream of the filter, downstream of the buffer tank
The results of the water quality analysis are presented in Table 3.
Table 3 Water Quality Analysis Results at Different Sampling Points for Wax Oil Hydrogenation
|
Sampling Point |
Temperature (°C) |
Dissolved Oxygen (mg/L) |
pH Value |
TN (mg/L) |
COD (mg/L) |
|
Desalted water (production) |
33.0 |
7.47 |
9.58 |
0.2 |
6 |
|
Desalted water (injection) |
32.0 |
7.30 |
9.51 |
0.1 |
4 |
|
Stripping purified water (production) |
65.0 |
2.28 |
9.87 |
14.9 |
112 |
|
Stripping purified water (injection) |
36.5 |
4.88 |
9.63 |
14.2 |
123 |
|
Post-tank water injection (with many tiny bubbles) |
32.0 |
2.89 |
7.63 |
6.8 |
112 |
Table 3 shows that the water quality indicators for desalted water at both the production and injection points are essentially identical. Therefore, only the desalted water injection point was selected as the representative sampling point for the desalted water line. Stripping purified water is produced by high-temperature stripping of acidic wastewater, which results in a relatively high production temperature. After pipeline transport, the injection temperature drops to 36.5 °C. As the temperature decreases, the dissolved oxygen content increases, both factors that promote microbial growth. Since the water quality of the stripping purified water at the injection point directly affects the water quality after the buffer tank, this injection point is selected as the representative sampling point for the stripping purified water line. In summary, three representative sampling points were chosen: desalted water injection, stripping purified water injection, and post-tank injection.
The wax oil hydrogenation water injection was changed from using 100% desalted water to an equal mixture of desalted water and stripping purified water. After 22 days of operation, the pressure gauge downstream of the water injection pump dropped from 0.20 MPa to 0.18 MPa. Upon disassembly, the pipeline filter was found to be blocked. During this period, water samples from the three selected sampling points were collected and analyzed for temperature, pH, dissolved oxygen, COD, TN, bacterial count, and other relevant indicators. The analysis results are presented in Figures 3 through 8.
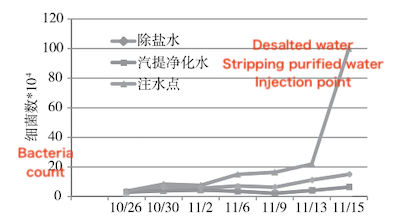
Figure 3 Variation of bacterial count over time at each sampling point
① Analysis of Changes in Bacterial Count
As shown in Fig. 3, following high-temperature stripping, the bacterial count in the stripping purified water injection remains relatively low. The bacterial count in the desalted water injection gradually increases over time. At the water injection point after the buffer tank, the bacterial count rises rapidly as time progresses. Bacteria grow and multiply in the buffer tank following the injection of mixed water, leading to an increase in bacterial count at the post-tank injection point. As the filter approaches blockage, the bacterial count at this point rises sharply, likely due to the reduced water flow velocity near the blockage, which causes bacteria and bacterial flocs to accumulate.
② Analysis of Temperature Changes
Most microorganisms thrive and reproduce optimally at temperatures between 20°C and 40°C; growth is inhibited outside this range. As shown in Figure 4, temperatures range from 28–34°C for desalted water injection, 32–41°C for stripping purified water injection, and 29–36°C at the post-tank injection point. These temperature ranges are highly conducive to microbial growth and provide favorable conditions for reproduction.
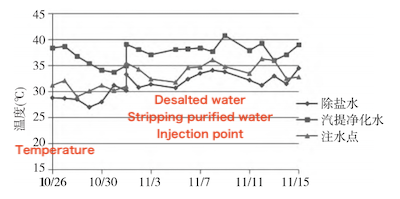
Figure 4 Variation of water sample temperature over time
③ Analysis of Dissolved Oxygen Changes
As shown in Figure 5, the dissolved oxygen concentration in the desalted water injection ranges between 6.5 and 7.0 mg/L. In the stripping purified water injection, it ranges from 0.8 to 1.6 mg/L, and in the post-tank injection water, it ranges from 1.2 to 2.2 mg/L. The water sample after the tank contains numerous tiny bubbles. Although the post-tank injection water is an equal mixture of desalted water and stripping purified water, its dissolved oxygen concentration is significantly lower than the average of the two. This may be due to dissolved oxygen escaping as tiny bubbles during the mixing process, combined with consumption of dissolved oxygen by microbial growth and reproduction in the mixed water.
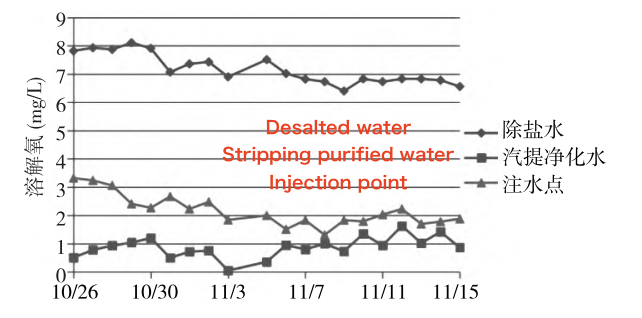
Figure 5 Variation in dissolved oxygen over time at each sampling point
Different microorganisms have varying dissolved oxygen requirements: aerobic microorganisms generally require at least 2 mg/L of dissolved oxygen. Facultative anaerobic microorganisms require dissolved oxygen levels between 0.2 and 2.0 mg/L, while anaerobic microorganisms thrive at levels below 0.2 mg/L. Therefore, the dissolved oxygen concentration in the desalted water injection is ideal for aerobic microbial growth, the stripping purified water injection supports anaerobic microorganisms, and the post-tank injection water can sustain both aerobic and anaerobic microbial growth.
④ Analysis of pH Changes
Each microorganism has an optimal pH range for growth, where its enzyme activity peaks. Under favorable conditions, microorganisms also exhibit their fastest growth within this range. The optimal pH for most bacteria, algae, and protozoa ranges from 6.5 to 7.5, although they can survive at pH levels between 4 and 10. As shown in Figure 6, the pH of the desalted water injection ranges from 8.2 to 9.2, while that of the stripping purified water injection ranges from 9.0 to 10.5; and the pH at the post-tank injection point ranges from 9.0 to 10.0. Although these values are above the optimal range for most microorganisms, they still fall within an acceptable range that supports microbial growth and reproduction.
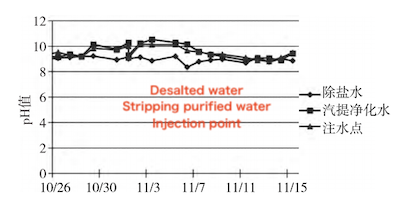
Figure 6 Variation of pH values over time at each sampling point
⑤ Analysis of COD Changes
The growth, reproduction, and metabolic activities of microorganisms depend heavily on the availability of nutrients. Carbon is a vital element for microbial cells, and carbon-containing organic matter in water serves as an important energy source. Chemical oxygen demand (COD) reflects the concentration of organic matter in water. In biological treatment systems, insufficient carbon sources can hinder microbial growth and metabolic activity. As shown in Figure 7, the COD of the desalted water injection is essentially 0 mg/L, while the COD of the stripping purified water injection ranges from 110 to 130 mg/L. The COD at the post-tank injection point ranges from 78 to 118 mg/L, which is significantly higher than the average COD of the desalted water and stripping purified water injections. This increase may be attributed to the accumulation of organic pollutants in the buffer tank. Over time, the COD at this point gradually decreases, likely due to the extensive reproduction of microorganisms that consume organic matter as a carbon source.
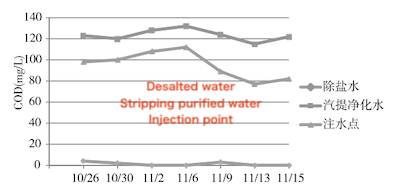
Figure 7 Variation of COD over time at each sampling point
In summary, the post-tank water contains a measurable concentration of carbon-containing organic matter, which serves as a carbon source for microorganisms and supports their growth and reproduction.
⑥ Total Nitrogen (TN) Change Analysis
Nitrogen is a vital element in microbial cells, as it is a key component of both proteins and nucleotides. Inorganic nitrogen sources include ammonium salts and nitrates, while some bacteria are also capable of assimilating gaseous nitrogen. As shown in Figure 8, the total nitrogen (TN) concentration in the demineralized water injection is essentially 0 mg/L; in the stripping purified water injection, it ranges from 13 to 16 mg/L; and at the post-tank injection point, it ranges from 11 to 13 mg/L. As with the COD trend, the elevated TN concentration at the post-tank injection point is likely attributed to the accumulation of organic pollutants in the buffer tank, resulting in values significantly higher than the average of the demineralized and stripping purified water injections. Over time, the TN level at this point gradually decreases, likely due to extensive microbial growth consuming nitrogen as a nutrient source. The post-tank injection water contains a certain concentration of nitrogenous compounds, providing the nitrogen source necessary for microbial growth and reproduction.
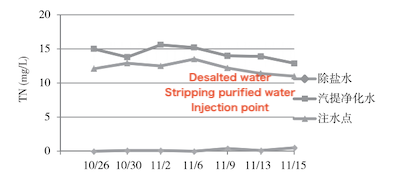
Figure 8 Variation of TN over time at each sampling point
Based on the analysis of water samples from various points, it is evident that the temperature and dissolved oxygen levels in the post-tank injection water are favorable for microbial growth and reproduction. The presence of organic matter in these samples provides microorganisms with essential nutrients, including carbon and nitrogen sources. Although the pH is slightly above the optimal range for most microorganisms, it remains within an acceptable range that supports their growth and reproduction. Therefore, the water environment downstream of the buffer tank is conducive to microbial proliferation. The residence time of the mixed demineralized and stripping purified water in the buffer tank further enhances these conditions, thereby promoting microbial growth. This microbial activity ultimately leads to the periodic clogging of the pipeline filter situated downstream of the buffer tank and upstream of the injection pump.
Based on visual inspection of the blockage, burning tests, and analysis of relevant water sample indicators, it was determined that the blockage was caused by massive microbial growth and accumulation. By analyzing water samples collected from different points, three key sampling locations were identified: desalted water injection, stripping purified water injection, and post-buffer tank injection. The temperature, pH, dissolved oxygen, COD, TN, and bacterial counts of water samples from each sampling point were monitored and tested. The results showed that the temperature and dissolved oxygen levels in the injection water favored microbial growth and reproduction. The contents of carbon, nitrogen, and other nutrients met the needs of microbial development; and although the pH was outside the optimal range for growth, it still allowed microbes to grow and reproduce. Therefore, it was concluded that the blockage in the wax oil hydrogenation water injection pipeline was caused by sticky deposits resulting from extensive microbial growth. Based on these findings and actual operating conditions, a practical antibacterial strategy was proposed and implemented. Specifically, the buffer tank and water pipeline were continuously flushed with 100% high-temperature stripping purified water for five days. Afterwards, the stripping purified water inlet pipeline was rerouted to bypass the buffer tank, while desalted water continued to flow into the buffer tank. Since implementing these measures, the wax oil hydrogenation and water injection system has operated normally for eight months without any blockages, effectively resolving the problem.


